Skip the download.
Insert directly into your slides.
Add templates right inside PowerPoint or Google Slides with our free add-in — no more downloading and importing.
 PowerPoint Add-In
  Google Slides
 You've used all your free downloads today. Upgrade or come back tomorrow.
Match your brand
in one click.
Our add-in automatically applies your brand colors, fonts, and logo to any template — zero design skills required.
You've used all your free downloads today. Upgrade or come back tomorrow.
Your brand deserves
better presentations.
Get fully-branded PowerPoint templates built around your company's identity — fonts, colors, and layouts, all custom-made.
You've used all your free downloads today. Upgrade or come back tomorrow.
Daily download limit reached
Free accounts get a limited number of downloads per day. Upgrade for unlimited access or try again tomorrow.
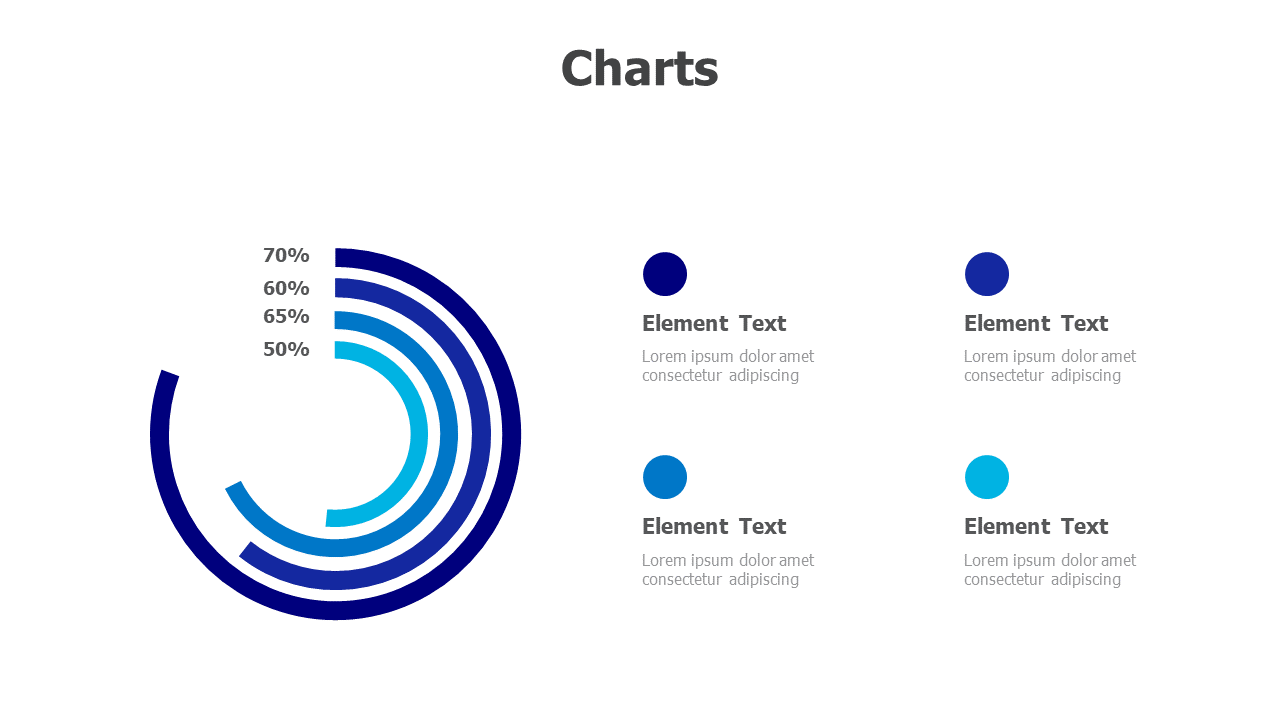
4-Elemente-Konzentrischer Ring-Datenchart
Über diese Vorlage
Dieses PowerPoint-Template bietet ein auffälliges konzentrisches Ringdiagramm mit 4 geschichteten Segmenten, die Prozentwerte (70 %, 60 %, 65 %, 50 %) neben den entsprechenden Elementbeschreibungen anzeigen. Perfekt für Geschäftsanalysten, Vermarkter und Berater, die hierarchische Daten, Leistungskennzahlen oder vergleichende Statistiken präsentieren müssen. Das blaue Farbverlauf-Design schafft visuelle Tiefe und bleibt gleichzeitig klar für professionelle Präsentationen.
Browse more Charts templates to find the perfect design for your presentation. Explore Charts →
Inhalt
- Match Your Brand in One Click
- PowerPoint (.pptx) & Google Slides
- 100% Editable — Colors, Text & Layout
- Free for Personal & Commercial Use
How to Edit This Template
Click Download Template to get the .pptx file
Open in PowerPoint or upload to Google Slides
Edit colors, text & data — or use our add-in for one-click branding


