Skip the download.
Insert directly into your slides.
Add templates right inside PowerPoint or Google Slides with our free add-in — no more downloading and importing.
 PowerPoint Add-In
  Google Slides
 You've used all your free downloads today. Upgrade or come back tomorrow.
Match your brand
in one click.
Our add-in automatically applies your brand colors, fonts, and logo to any template — zero design skills required.
You've used all your free downloads today. Upgrade or come back tomorrow.
Your brand deserves
better presentations.
Get fully-branded PowerPoint templates built around your company's identity — fonts, colors, and layouts, all custom-made.
You've used all your free downloads today. Upgrade or come back tomorrow.
Daily download limit reached
Free accounts get a limited number of downloads per day. Upgrade for unlimited access or try again tomorrow.
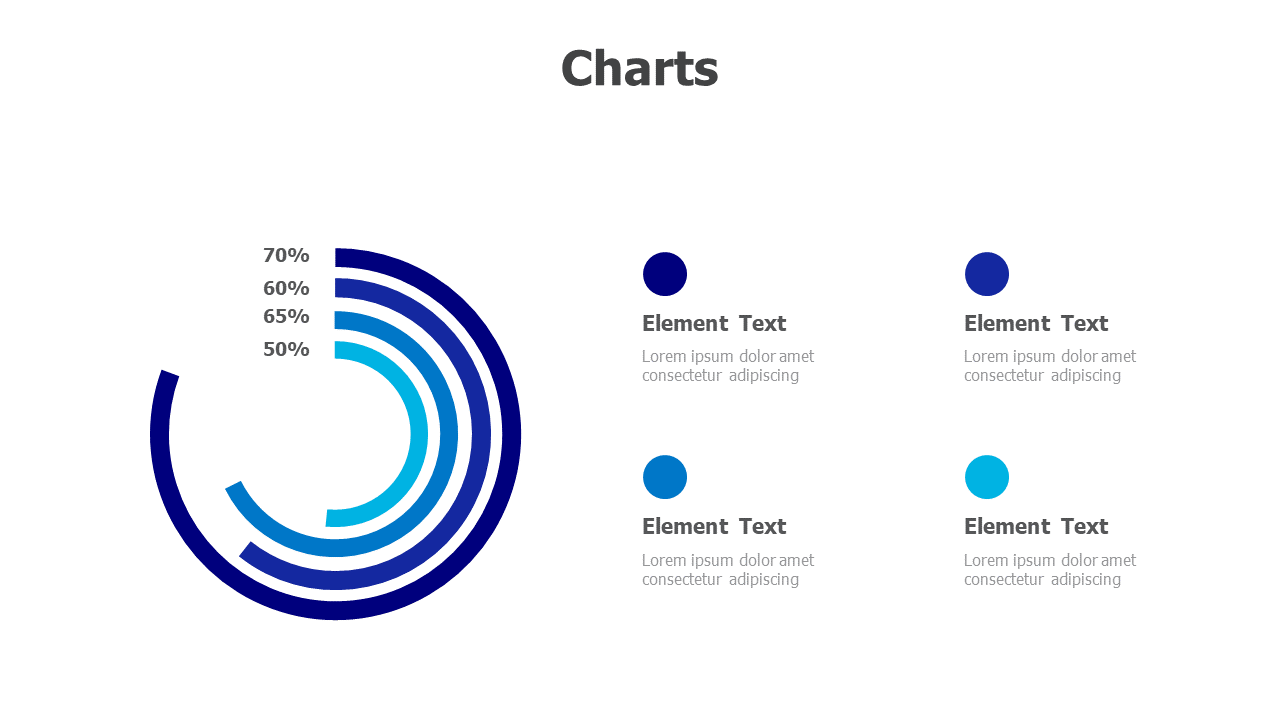
4-Element Concentric Ring Data Chart
About This Template
This PowerPoint template features a striking concentric ring chart with 4 layered segments displaying percentage values (70%, 60%, 65%, 50%) alongside corresponding element descriptions. Perfect for business analysts, marketers, and consultants who need to present hierarchical data, performance metrics, or comparative statistics. The blue gradient design creates visual depth while maintaining clarity for professional presentations.
Browse more Charts templates to find the perfect design for your presentation. Explore Charts →
What's Included
- Match Your Brand in One Click
- PowerPoint (.pptx) & Google Slides
- 100% Editable — Colors, Text & Layout
- Free for Personal & Commercial Use
How to Edit This Template
Click Download Template to get the .pptx file
Open in PowerPoint or upload to Google Slides
Edit colors, text & data — or use our add-in for one-click branding


