Skip the download.
Insert directly into your slides.
Add templates right inside PowerPoint or Google Slides with our free add-in — no more downloading and importing.
 PowerPoint Add-In
 Google Slides
You've used all your free downloads today. Upgrade or come back tomorrow.
Match your brand
in one click.
Our add-in automatically applies your brand colors, fonts, and logo to any template — zero design skills required.
You've used all your free downloads today. Upgrade or come back tomorrow.
Your brand deserves
better presentations.
Get fully-branded PowerPoint templates built around your company's identity — fonts, colors, and layouts, all custom-made.
You've used all your free downloads today. Upgrade or come back tomorrow.
Daily download limit reached
Free accounts get a limited number of downloads per day. Upgrade for unlimited access or try again tomorrow.
Charts PowerPoint Templates & Google Slides
Browse over 9,093+ editable templates for stunning presentations. Download, customize, and present — it's that simple.
Match Your Brand in One Click
Auto-apply your brand colors, fonts, and logo to any template instantly.
100% Editable Slides
Every element is fully customizable — colors, text, layout, and data points.
Insert Directly into Slides
Use our free add-in to insert templates right inside PowerPoint or Google Slides.
Download Charts templates for PowerPoint & Google Slides
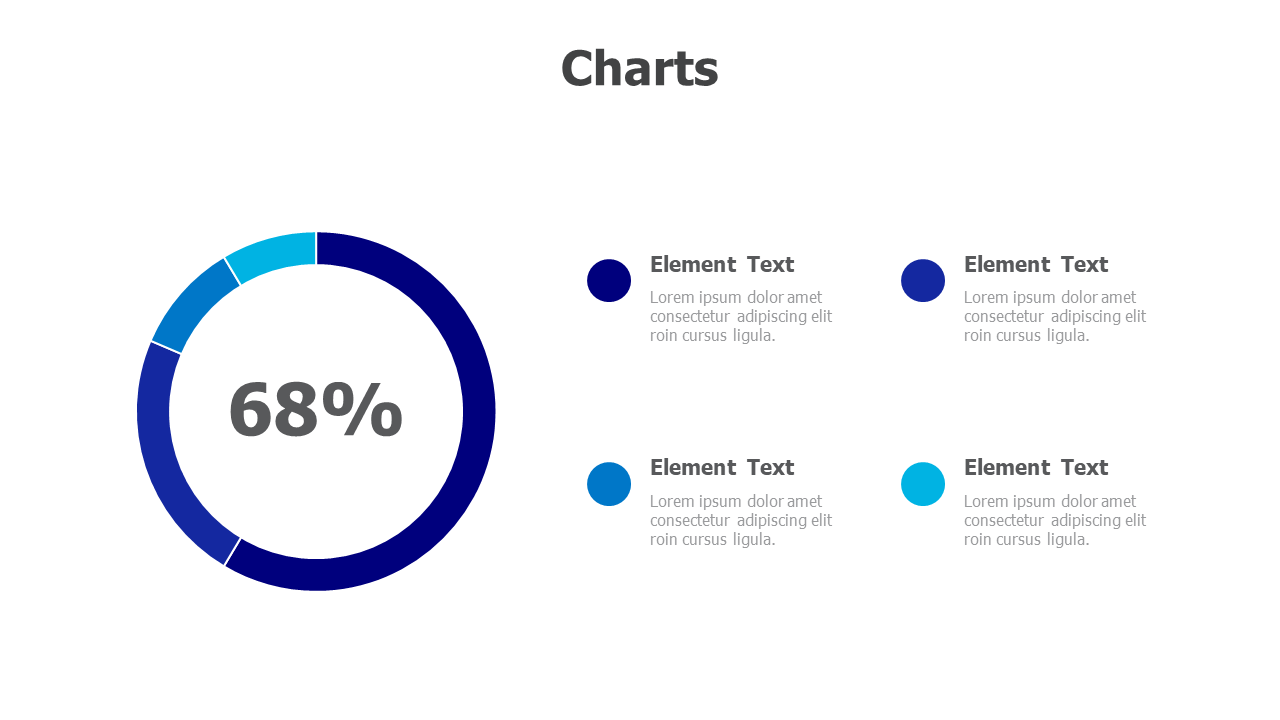
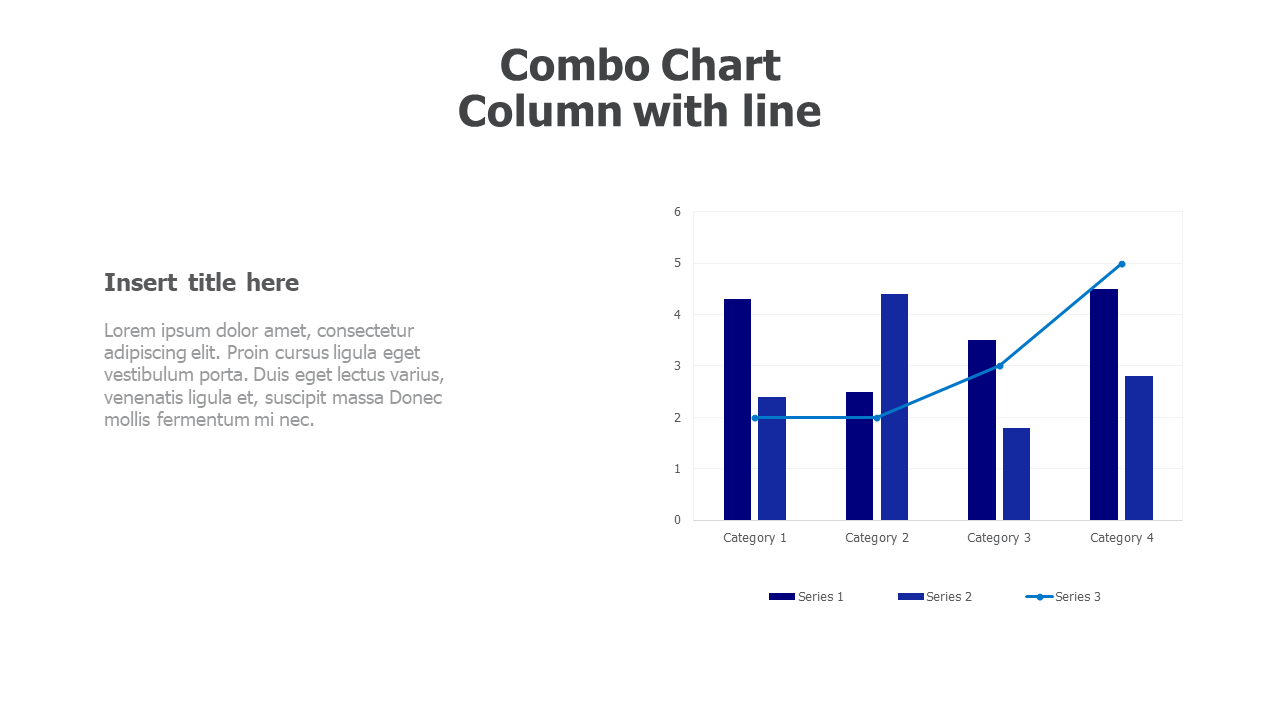
Charts templates are an essential tool for creating informative and visually appealing PowerPoint presentations and slides that effectively communicate data. These templates are available in various forms, including bar charts, pie charts, line graphs, and scatter plots, to name a few. Charts templates make it easy to showcase data in a structured and organized manner, allowing the audience to gain insights quickly. They are customizable, which means they can be tailored to suit different presentation styles, and they save time as users do not need to create the charts from scratch. In conclusion, Charts templates are must-have tools for creating presentations that effectively communicate data. They are efficient, informative, and visually appealing, making it easy for audiences to understand complex information.


How to Use Charts Templates
1. Choose a Template
Browse our Charts collection and pick the design that fits your presentation needs.
2. Customize with Your Brand
Edit colors, fonts, text, and data points. Use our add-in to apply your branding in one click.
3. Present with Confidence
Your slides are ready. Present in PowerPoint, Google Slides, or export to PDF.
Frequently Asked Questions
Explore a variety of chart slides in our Charts category, including bar charts, line graphs, pie charts, and more. Each template is designed to visually enhance your presentations and effectively convey data-driven insights.
Personalize your chart slides effortlessly! Utilize our one-click customization feature to align the slides with your presentation's theme, including colors, fonts, and visual elements. This ensures a cohesive and professional look for your data visualizations.
Absolutely! Our chart slides are versatile and suitable for presenting various types of data, analyses, and visual representations. Whether you're showcasing financial data, project timelines, or performance metrics, these templates cater to your specific charting needs.
Yes, our chart slides are designed for flexibility. Easily add or modify data based on your presentation needs. The templates provide a user-friendly structure that allows you to adapt them to your unique charting content.
Incorporating chart slides is simple. Download the templates and seamlessly integrate them into your PowerPoint presentations. The structured layout of the chart slides will enhance the clarity and impact of your data visualizations.
Certainly! Use our intuitive search bar to input keywords related to the specific type of chart slide you're looking for. This efficient search functionality allows you to quickly locate and use the ideal template for your presentations.
Yes, you have the flexibility to customize the layout of the chart slides. Adjust the structure and design elements to align with your unique presentation style, ensuring a polished and cohesive look throughout your data-driven presentations.
Accessing the Charts Slides Templates Category is straightforward. Visit the Microsoft Store, search for our add-on, and click "Get it now" to seamlessly integrate the slides into your PowerPoint. No complex setup or technical expertise needed – just one click to enhance your chart presentations.