Skip the download.
Insert directly into your slides.
Add templates right inside PowerPoint or Google Slides with our free add-in — no more downloading and importing.
 PowerPoint Add-In
  Google Slides
 You've used all your free downloads today. Upgrade or come back tomorrow.
Match your brand
in one click.
Our add-in automatically applies your brand colors, fonts, and logo to any template — zero design skills required.
You've used all your free downloads today. Upgrade or come back tomorrow.
Your brand deserves
better presentations.
Get fully-branded PowerPoint templates built around your company's identity — fonts, colors, and layouts, all custom-made.
You've used all your free downloads today. Upgrade or come back tomorrow.
Daily download limit reached
Free accounts get a limited number of downloads per day. Upgrade for unlimited access or try again tomorrow.
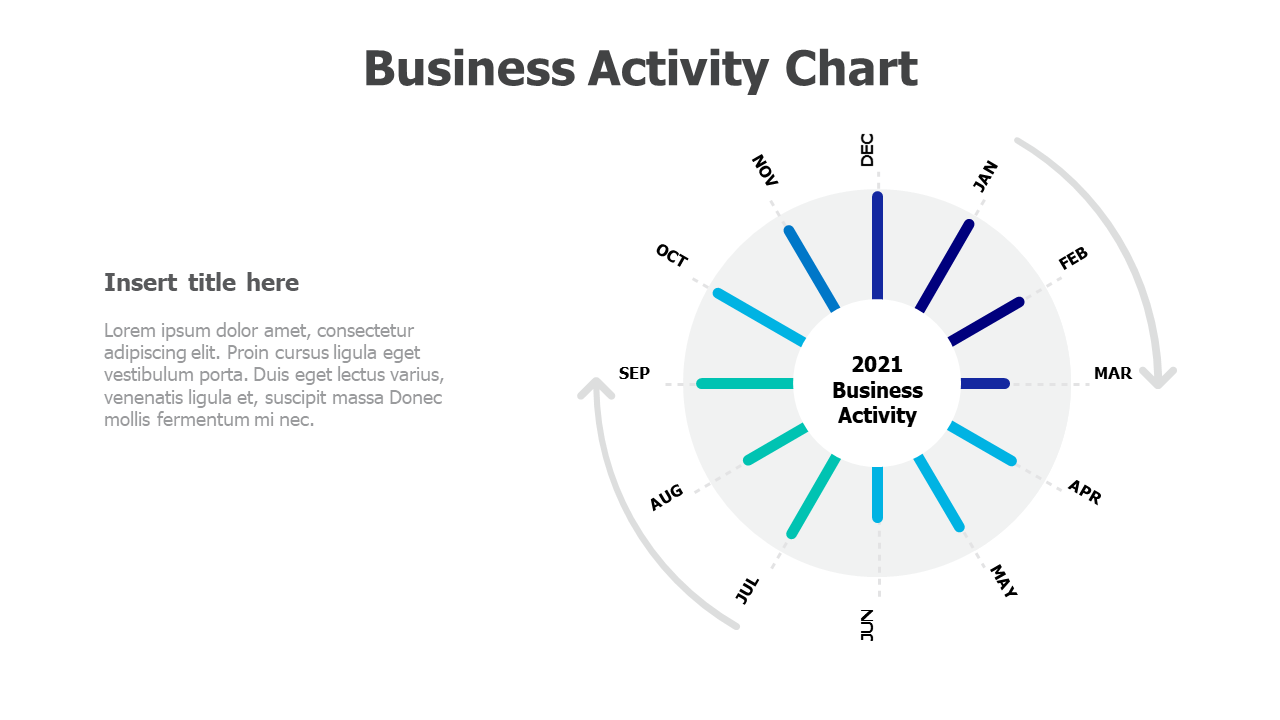
Jährliche Geschäftstätigkeit Radialdiagramm
Über diese Vorlage
Präsentieren Sie Ihre jährliche Geschäftsentwicklung mit dieser Radialdiagramm-Vorlage, die 12 monatliche Datenpunkte in einem zirkulären Layout anzeigt. Ideal für Führungskräfte und Analysten, die jährliche Trends, saisonale Muster oder monatliche KPIs präsentieren. Die Höhe der Balken jedes Monats ist vollständig bearbeitbar, um Ihren spezifischen Datenwerten zu entsprechen, mit einem Farbverlauf von Blau zu Türkis, der die visuelle Anziehungskraft erhöht.
Browse more Charts templates to find the perfect design for your presentation. Explore Charts →
Inhalt
- Match Your Brand in One Click
- PowerPoint (.pptx) & Google Slides
- 100% Editable — Colors, Text & Layout
- Free for Personal & Commercial Use
How to Edit This Template
Click Download Template to get the .pptx file
Open in PowerPoint or upload to Google Slides
Edit colors, text & data — or use our add-in for one-click branding


