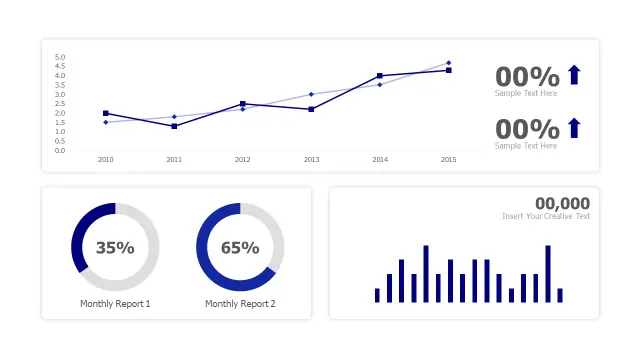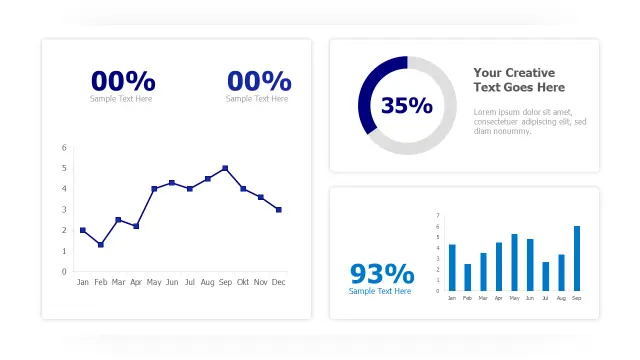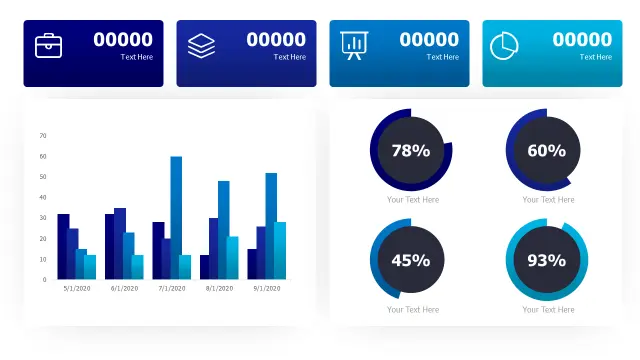
This is the go-to pick for quarterly business reviews. The four metric cards across the top give executives an instant headline read, while the multi-series bar chart below handles month-over-month comparisons without crowding the slide. The circular progress charts in the lower section are ideal when you need to show percentage targets — think NPS scores, budget utilization, or project completion rates.
The blue analytics palette reads cleanly on projected screens and video calls, which is why it leads download counts by a wide margin. Use it when you need one slide that carries an entire performance story.