Skip the download.
Insert directly into your slides.
Add templates right inside PowerPoint or Google Slides with our free add-in — no more downloading and importing.
 PowerPoint Add-In
  Google Slides
 You've used all your free downloads today. Upgrade or come back tomorrow.
Match your brand
in one click.
Our add-in automatically applies your brand colors, fonts, and logo to any template — zero design skills required.
You've used all your free downloads today. Upgrade or come back tomorrow.
Your brand deserves
better presentations.
Get fully-branded PowerPoint templates built around your company's identity — fonts, colors, and layouts, all custom-made.
You've used all your free downloads today. Upgrade or come back tomorrow.
Daily download limit reached
Free accounts get a limited number of downloads per day. Upgrade for unlimited access or try again tomorrow.
六个月项目甘特时间线图
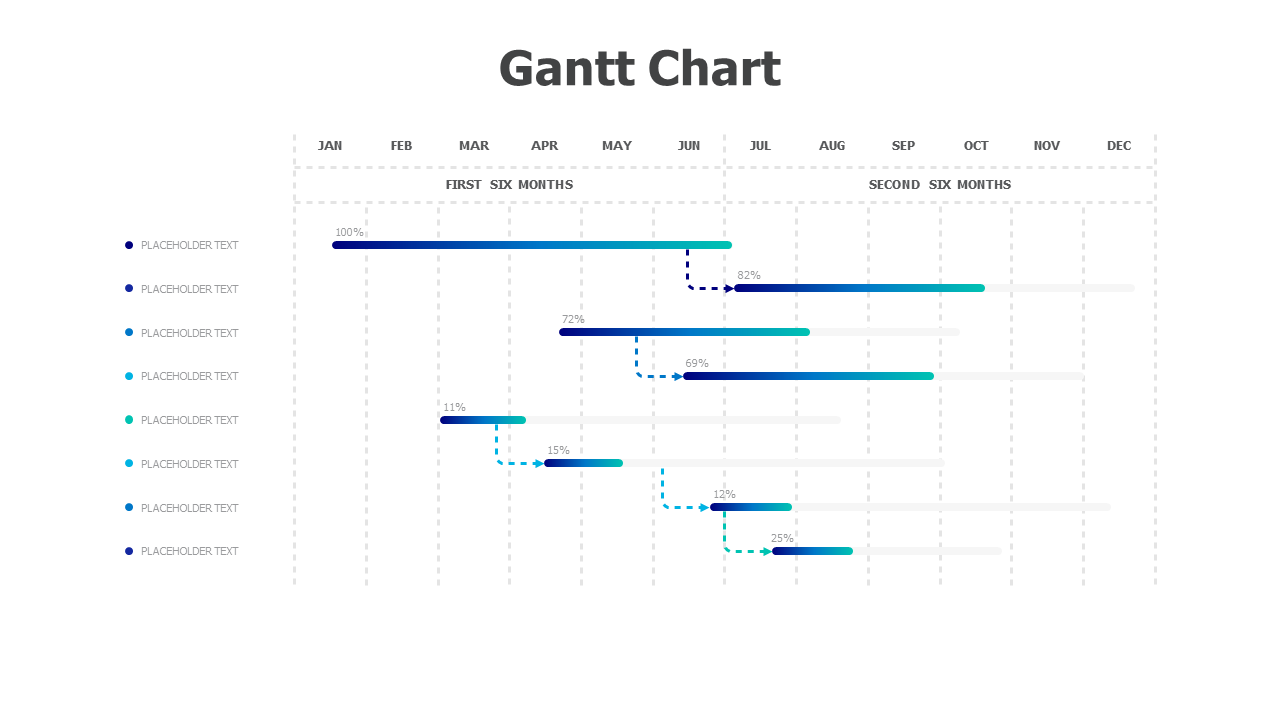
关于此模板
专业的半年甘特图模板,展示跨两个六个月的项目时间线,具有百分比完成跟踪。特征为8个任务行,带有蓝色渐变进度条、从一月到十二月的每月列和虚线里程碑连接器。非常适合项目经理、商业分析师和团队规划长期计划,需要清晰的视觉进展跟踪和截止日期管理。
Browse more Charts templates to find the perfect design for your presentation. Explore Charts →
包含内容
- Match Your Brand in One Click
- PowerPoint (.pptx) & Google Slides
- 100% Editable — Colors, Text & Layout
- Free for Personal & Commercial Use
How to Edit This Template
Click Download Template to get the .pptx file
Open in PowerPoint or upload to Google Slides
Edit colors, text & data — or use our add-in for one-click branding


