Skip the download.
Insert directly into your slides.
Add templates right inside PowerPoint or Google Slides with our free add-in — no more downloading and importing.
 PowerPoint Add-In
  Google Slides
 You've used all your free downloads today. Upgrade or come back tomorrow.
Match your brand
in one click.
Our add-in automatically applies your brand colors, fonts, and logo to any template — zero design skills required.
You've used all your free downloads today. Upgrade or come back tomorrow.
Your brand deserves
better presentations.
Get fully-branded PowerPoint templates built around your company's identity — fonts, colors, and layouts, all custom-made.
You've used all your free downloads today. Upgrade or come back tomorrow.
Daily download limit reached
Free accounts get a limited number of downloads per day. Upgrade for unlimited access or try again tomorrow.
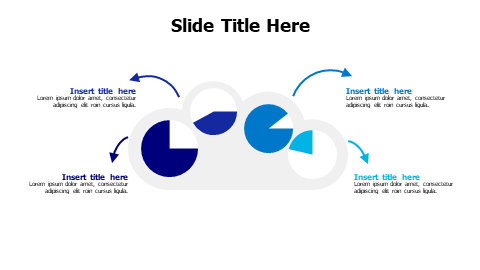
Four Pie Chart Cloud Computing Dashboard
关于此模板
Present complex data relationships with this cloud-shaped infographic featuring four interconnected pie charts. Perfect for IT professionals and business analysts showcasing cloud infrastructure metrics, software performance data, or multi-department statistics. Each chart section includes editable text areas and customizable color schemes for comprehensive data visualization.
浏览更多 Charts 模板,为您的演示找到完美设计。 探索 Charts →
包含内容
- 一键匹配您的品牌
- PowerPoint (.pptx) & Google Slides
- 100% 可编辑 — 颜色、文字 & 布局
- 免费用于个人 & 商业用途
如何编辑此模板
点击 下载模板 获取 .pptx 文件
在 PowerPoint 中打开或上传到 Google Slides
编辑颜色、文字 & 数据 — 或使用我们的插件一键品牌化


