Skip the download.
Insert directly into your slides.
Add templates right inside PowerPoint or Google Slides with our free add-in — no more downloading and importing.
 PowerPoint Add-In
  Google Slides
 You've used all your free downloads today. Upgrade or come back tomorrow.
Match your brand
in one click.
Our add-in automatically applies your brand colors, fonts, and logo to any template — zero design skills required.
You've used all your free downloads today. Upgrade or come back tomorrow.
Your brand deserves
better presentations.
Get fully-branded PowerPoint templates built around your company's identity — fonts, colors, and layouts, all custom-made.
You've used all your free downloads today. Upgrade or come back tomorrow.
Daily download limit reached
Free accounts get a limited number of downloads per day. Upgrade for unlimited access or try again tomorrow.
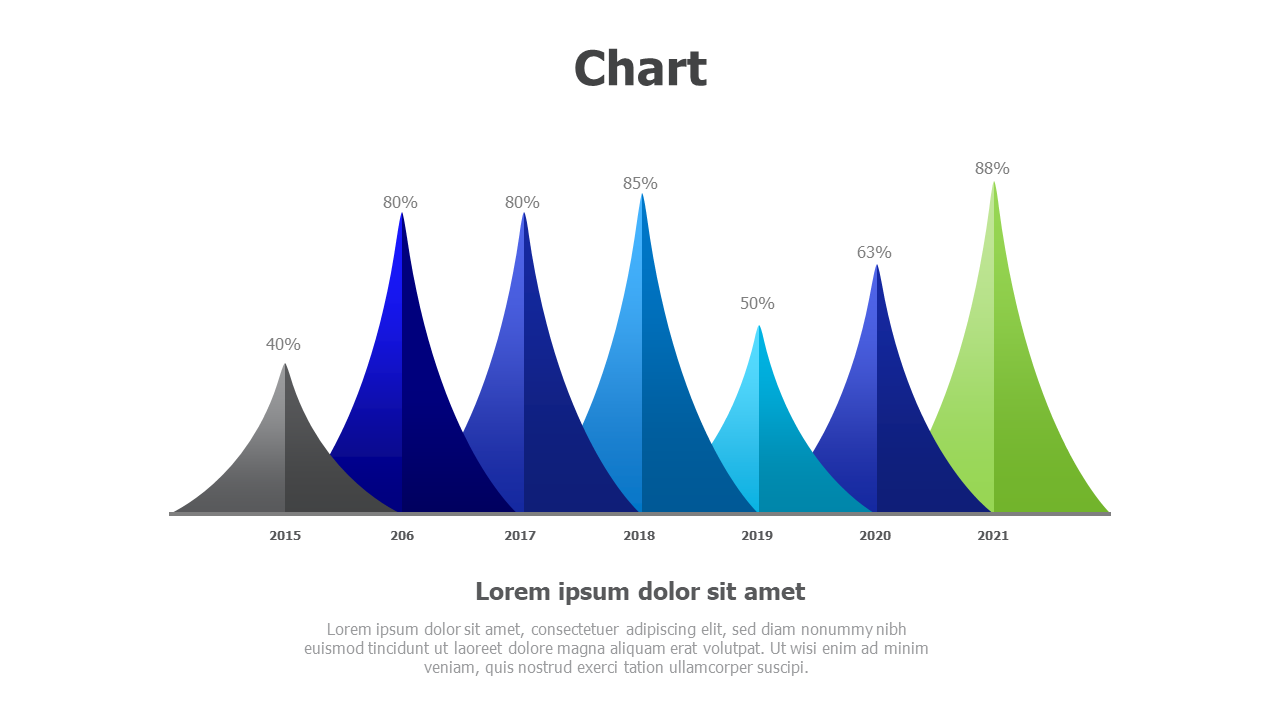
七年绩效三角山图
关于此模板
使用这个独特的山式图表可视化多年的数据趋势,展示七个三角峰,代表2015-2021年的绩效指标。非常适合年度报告、业务回顾和进展演示。每个三角形的高度对应百分比值,创建出引人入胜的增长模式和绩效波动的视觉叙事。
Browse more Charts templates to find the perfect design for your presentation. Explore Charts →
包含内容
- Match Your Brand in One Click
- PowerPoint (.pptx) & Google Slides
- 100% Editable — Colors, Text & Layout
- Free for Personal & Commercial Use
How to Edit This Template
Click Download Template to get the .pptx file
Open in PowerPoint or upload to Google Slides
Edit colors, text & data — or use our add-in for one-click branding


