Top 10 · Round

Top 10 Round PowerPoint Templates with Examples (2026)

Round PowerPoint templates give circular data, cyclical processes, and radial frameworks the visual structure they deserve. A flat bullet list can't communicate continuous flow or interconnected stages the way a well-designed circular layout can — and that's exactly why these templates consistently rank among the most downloaded infographic formats for business presentations.

This list covers the 10 most-downloaded round PowerPoint templates on PPT-Design, ranging from gear-driven process cycles and donut charts to flower petal layouts and semi-circular checklists. Whether you're a project manager mapping a validation workflow, a consultant presenting market share, or a trainer illustrating a multi-phase methodology, there's a specific template here built for your use case.

When choosing a round template, consider two things first: how many segments you need (matching step count to segment count avoids awkward empty spaces), and whether your data is proportional or sequential. Donut charts suit proportional data; segmented circular diagrams work better for ordered process steps. Both types in this list support full PowerPoint customization — colors, icons, and text placeholders all editable through the Format Shape and Selection Pane tools in the ribbon.

Free download Fully editable PowerPoint + Google Slides
1 2 3 4 5 6 7 8 9 10
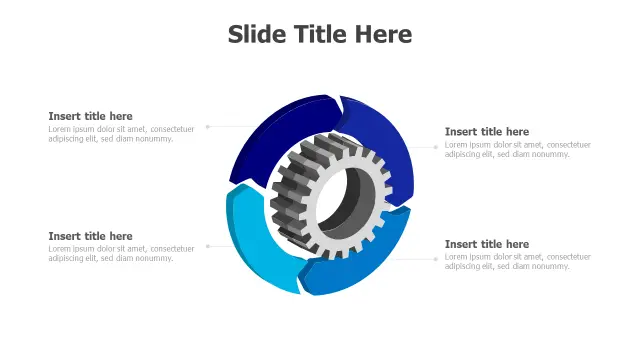
4-Stage Process Gear Cycle Infographic
Free PowerPoint + Google Slides 671+ downloads

The 4-Stage Process Gear Cycle Infographic is the right pick when you need to show a repeating operational loop — think Plan-Do-Check-Act or a four-phase product lifecycle. The central 3D gear adds a mechanical metaphor that reinforces the idea of interlocking, interdependent stages rather than a simple linear list.

The blue gradient palette keeps it professional across both projected slides and printed handouts. With only four segments, each section gets generous text space, so this works especially well when each stage needs a short label plus a supporting sentence.
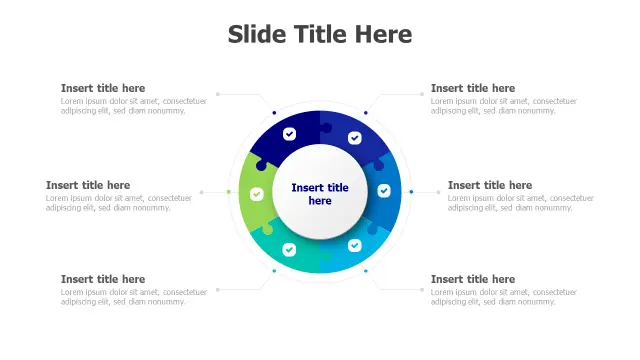
Six Section Circular Puzzle Infographic Template
Free PowerPoint + Google Slides 605+ downloads

Six interconnected puzzle pieces make this template the natural choice for frameworks where every element depends on the others — team collaboration models, integrated marketing strategies, or quality management systems where removing one piece visibly breaks the whole picture.

The checkmark icons per segment make it easy to repurpose as a readiness checklist or milestone tracker. Swap the default blue-green gradient in Format Shape > Fill to match your brand palette without redesigning the layout.

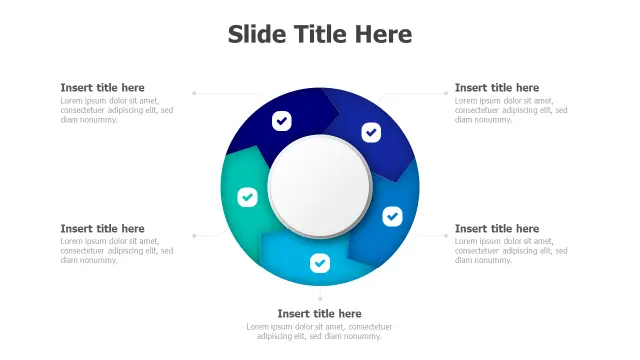
5-Section Circular Process Checkmark Infographic
Free PowerPoint + Google Slides 354+ downloads

Five segments hits the sweet spot for process presentations: enough steps to feel substantive, few enough that each gets readable text at standard slide dimensions. The checkmark icons make this template particularly effective for project status updates or onboarding checklists where audiences need to confirm completion at each stage.

The 3D effect gives the segments visual depth that reads well on large screens during live presentations, and the blue-to-teal gradient direction naturally guides the eye around the cycle.

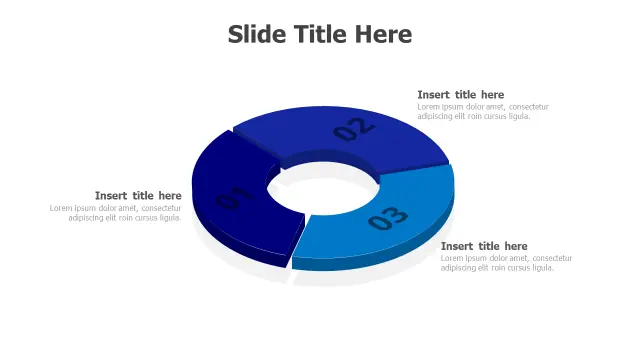
3-Section Donut Chart Infographic
Free PowerPoint + Google Slides 340+ downloads

When your data is proportional rather than sequential — budget splits, survey results, market share breakdowns — a donut chart beats a segmented process diagram every time. This three-section version is ideal when you have exactly three categories to compare and want the central void to hold a summary stat or KPI value.

Three sections also means each slice is large enough that color labels and percentages remain legible without callout lines crowding the slide. A clean, analyst-friendly choice for financial decks and executive dashboards.

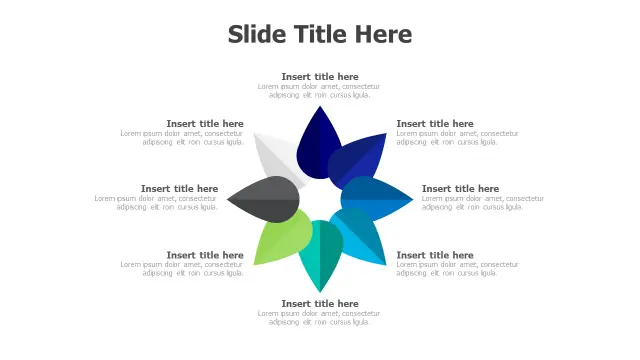
8-Petal Flower Radial Process Layout
Free PowerPoint + Google Slides 317+ downloads

The eight-petal radial layout suits strategic frameworks where multiple factors contribute equally to a central outcome — competency models, balanced scorecard categories, or product feature comparisons. Unlike segmented ring diagrams, the petal shape visually separates each item so audiences can scan topics without following a strict sequence.

Each petal's dedicated title-and-description space accommodates more copy than most circular templates allow, making this a strong option when your audience needs context alongside labels rather than just a heading.

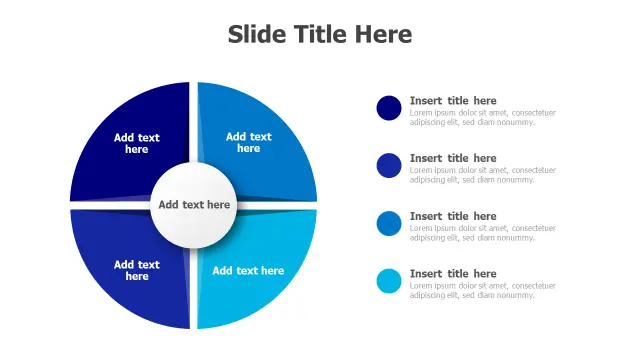
Four Segment Donut Chart Infographic
Free PowerPoint + Google Slides 115+ downloads

A four-segment donut is the go-to slide for showing balanced data categories where equal visual weight matters — quarterly performance across four regions, a 2×2 strategic priority split, or a four-part budget allocation. The central text area is purpose-built for a total figure or key takeaway that ties the segments together.

The gradient blue tones keep all four segments visually distinct while maintaining a cohesive, single-brand look that doesn't require any color adjustments straight out of the download.

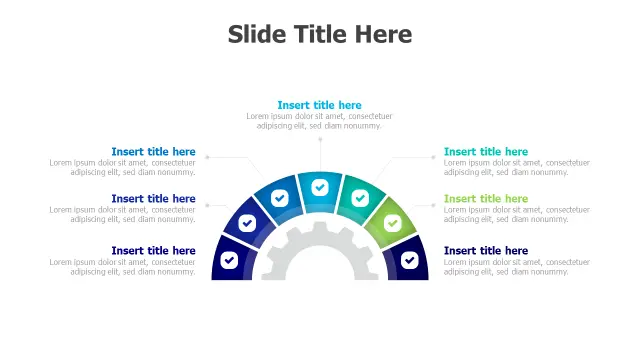
7-Step Process Half-Circle Checklist Infographic
Free PowerPoint + Google Slides 108+ downloads

Seven steps arranged in a half-circle is an uncommon but practical layout — it fits naturally on a standard 16:9 slide without the segments becoming too narrow to read, which is a real problem with full-circle seven-step diagrams. The central gear element anchors the checklist visually and reinforces a systematic, process-driven message.

Project managers presenting phased rollouts or quality control workflows will find the checkmark icons per step immediately useful without needing to insert custom shapes from the ribbon.

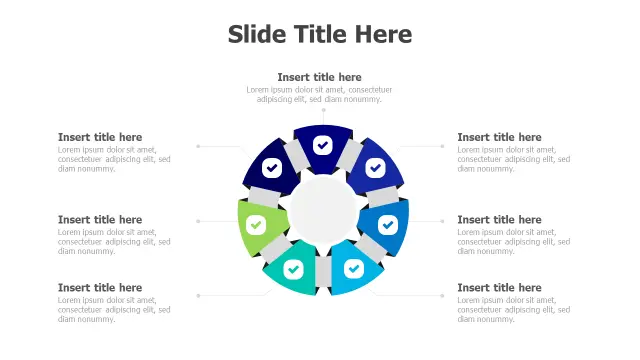
7-Stage Circular Process Validation Diagram
Free PowerPoint + Google Slides

The seven-segment full-circle layout works well for validation and compliance workflows where every stage must be completed before the next begins — think ISO certification steps, software QA cycles, or regulatory approval sequences. The central hub reinforces the idea that all stages connect back to a single governing objective.

At seven segments the text space per section is tighter than five- or four-segment alternatives, so this template performs best when your labels are short and a supporting slide carries the detail.

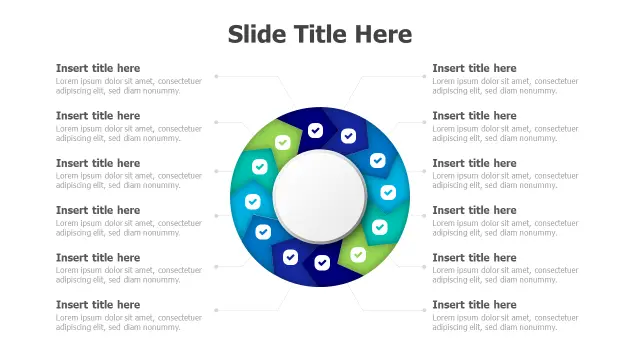
10-Step Circular Process Flow Diagram
Free PowerPoint + Google Slides

Ten segments in a circular layout is ambitious, and this template handles it by keeping the design clean and relying on a blue-to-green gradient progression that visually communicates movement around the cycle. It's the right choice for continuous improvement methodologies like Six Sigma DMAIC extended phases, or detailed SOPs where every discrete step must appear on one diagram.

Given the segment count, plan your text carefully — short action-verb labels per step work better here than full sentences, with detail deferred to speaker notes or a follow-up slide.

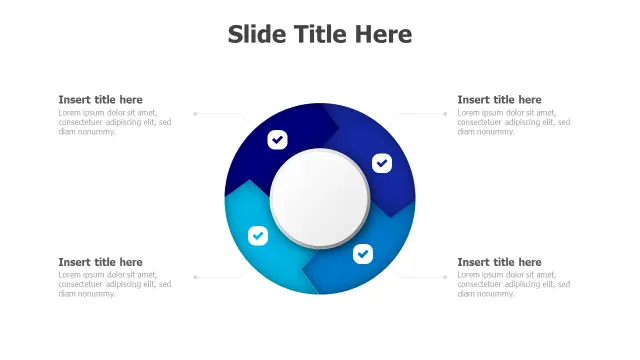
4-Stage Circular Process Workflow Diagram
Free PowerPoint + Google Slides

This circular infographic template features four interconnected segments in blue gradient colors with checkmark icons, perfect for presenting cyclical processes, workflow stages, or continuous improvement cycles. Ideal for business consultants, project managers, and educators who need to visualize sequential steps that

Frequently Asked Questions

What are round PowerPoint templates used for?

Round templates visualize cyclical processes, proportional data (donut charts), and radial frameworks. They work best when your content has no fixed start or end point, or when you want to show how multiple elements contribute equally to a central outcome.

How do I edit the colors in a circular PowerPoint template?

Select any shape, go to Format Shape in the ribbon, then choose Fill > Gradient Fill or Solid Fill. For multiple segments at once, use the Selection Pane (Home > Arrange > Selection Pane) to multi-select shapes and apply a consistent color change across all segments.

How many segments should a circular process diagram have?

Match segment count to your actual process steps — don't add or remove steps to fit the template. Four to six segments offer the best text legibility at standard slide dimensions. Beyond eight segments, labels become tight and a list or table layout may communicate more clearly.

What's the difference between a donut chart and a circular process diagram?

A donut chart shows proportional data — each segment's size reflects its percentage of a whole. A circular process diagram uses equal-sized segments to show sequential or interconnected steps where size carries no meaning. Choose based on whether your data is quantitative or procedural.

Can I animate circular infographic templates in PowerPoint?

Yes. Apply Appear or Wipe animations (Animations tab) to each segment individually, then use the Animation Pane to sequence them in clockwise order. Set each animation to start On Click or After Previous to walk your audience through each stage one at a time.

Looking for more Round templates?

Browse the full library of Round PowerPoint and Google Slides templates — fully editable, free to download.

Browse all Round templates