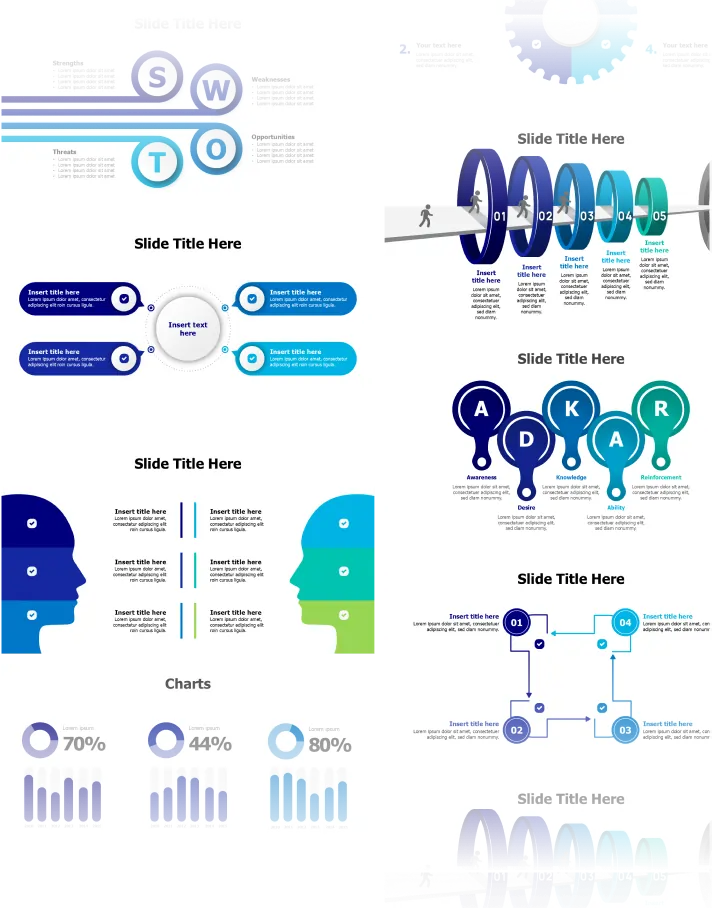
Fishbone infographics PowerPoint templates are an excellent way to visually represent the causes and effects of an issue or problem. These templates feature a diagram that looks like a fishbone, with each branch representing different factors that contribute to the problem. Fishbone infographics are a useful tool for root cause analysis, brainstorming, and problem-solving sessions. They can be used by project managers, team leaders, or individuals to identify the root cause of a problem and develop solutions to address it. Fishbone infographics templates are easily customizable, allowing the presenter to adjust the size, shape, and color of the branches to suit their specific needs. In conclusion, using Fishbone infographics PowerPoint templates is an effective method for presenting complex issues in a clear and understandable way, making it easier to identify and solve problems.
1. What types of fishbone infographic slides are available in the Fishbone category?
Explore a variety of fishbone infographic slides, including Ishikawa diagrams, cause-and-effect graphics, and problem-solving illustrations. Each template is designed to visually enhance your presentations and effectively communicate complex relationships and root causes.
2. How can I customize the fishbone infographic slides to match the theme of my presentation?
Personalize your fishbone infographic slides effortlessly! Utilize our one-click customization feature to align the slides with your presentation's theme, including colors, fonts, and visual elements. This ensures a cohesive and professional look for your problem-solving graphics.
3. Are the fishbone infographic slides suitable for analyzing various issues and processes?
Absolutely! Our fishbone infographic slides are versatile and suitable for analyzing a wide range of issues, processes, and complex relationships. Whether you're presenting a root cause analysis or problem-solving strategies, these templates provide the visual impact you need.
4. Can I add or modify elements easily using the fishbone infographic slides to fit my specific design requirements?
Yes, our fishbone infographic slides offer flexibility. Easily add or modify elements to fit your specific design requirements. The templates provide a user-friendly structure that allows you to adapt them to your unique problem-solving concepts and content.
5. How can I incorporate the fishbone infographic slides into my PowerPoint presentations?
Incorporating fishbone infographic slides is simple. Download the templates and seamlessly integrate them into your PowerPoint presentations. The visually dynamic nature of the fishbone graphics will enhance the clarity and impact of your problem-solving-themed presentations.
6. Is there a quick way to find a specific type of fishbone infographic slide within the category?
Certainly! Use our intuitive search bar to input keywords related to the specific type of fishbone infographic slide you're looking for. This efficient search functionality allows you to quickly locate and use the ideal template for your presentations.
7. Can I use the fishbone infographic slides in combination with other templates from different categories?
Yes, our fishbone infographic slides can be seamlessly integrated with other templates from different categories. Create comprehensive presentations by combining fishbone graphics with charts, timelines, and other visual elements to enhance your problem-solving storytelling.
8. How do I access the Fishbone Infographic Slides Templates Category on the Microsoft Store?
Accessing the Fishbone Infographic Slides Templates Category is straightforward. Visit the Microsoft Store, search for our add-on, and click "Get it now" to seamlessly integrate the slides into your PowerPoint. No complex setup or technical expertise needed – just one click to elevate your problem-solving-themed presentations.