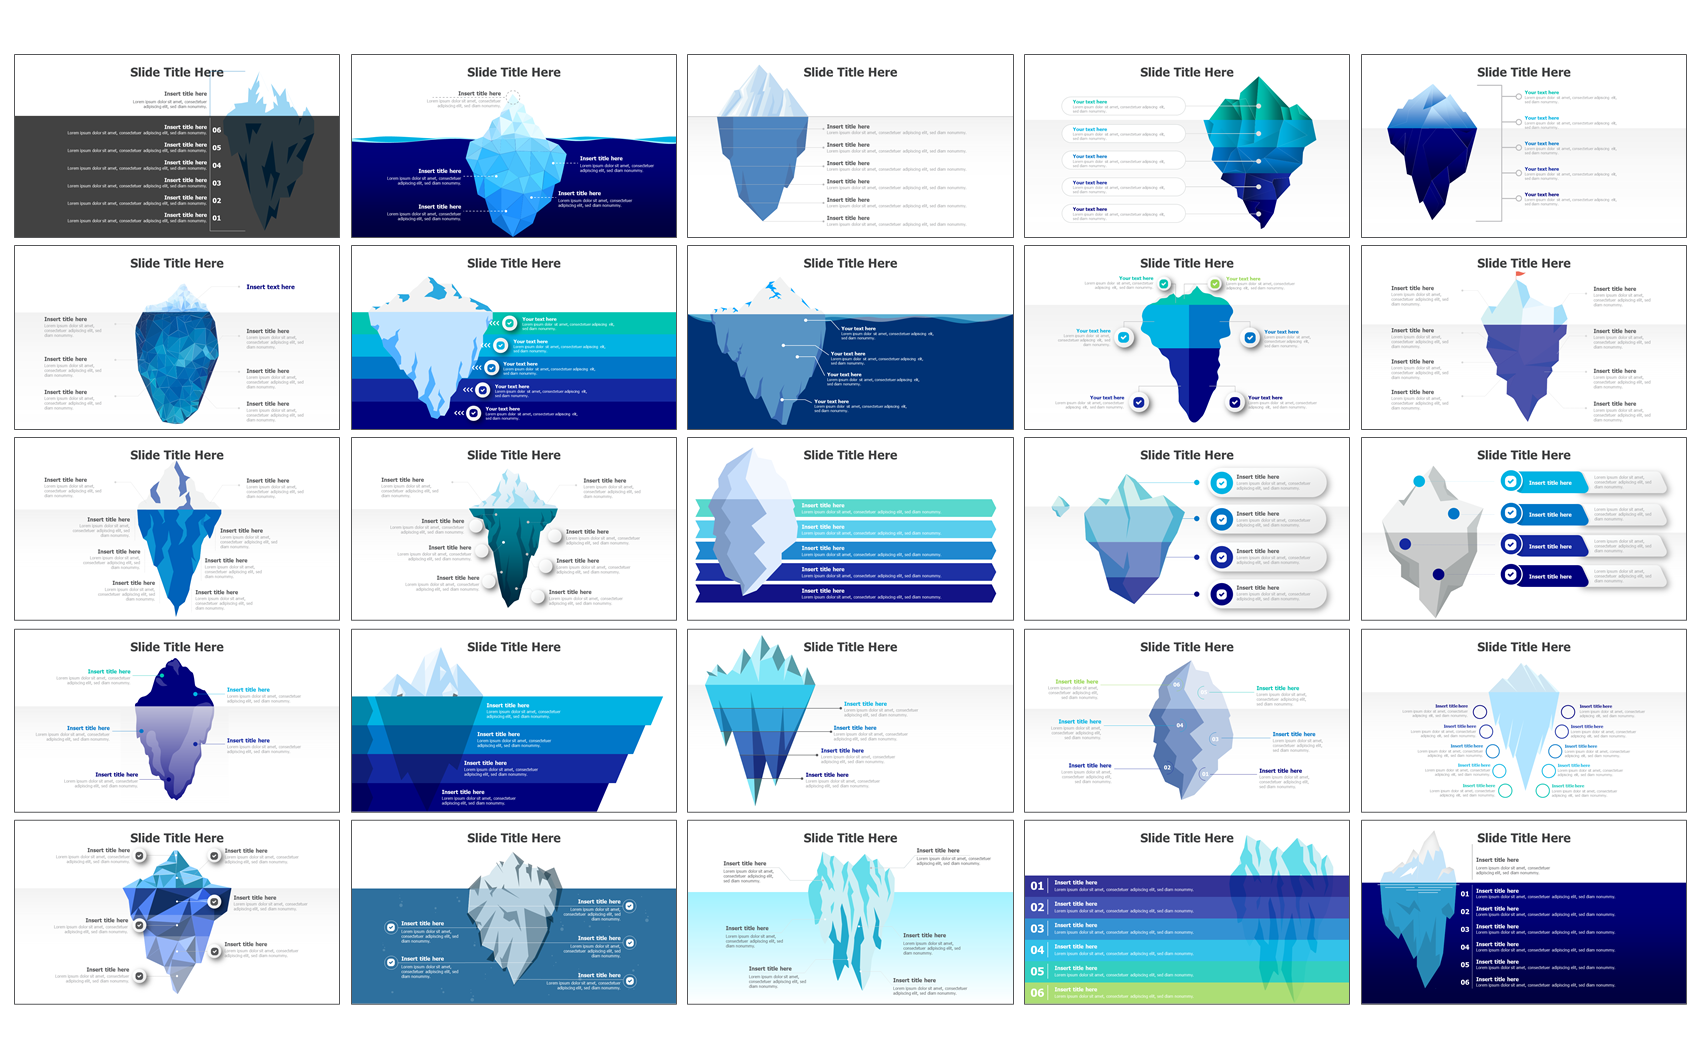
An iceberg infographic is a visual representation of a complex issue or concept, where the bulk of the information is hidden beneath the surface. The iceberg is used as a metaphor to show that what is visible on the surface is just a small part of a larger issue or problem. In this article, we’ll take you through the steps on how to create an iceberg infographic in PowerPoint.
Step 1: Determine the topic
The first step to creating an iceberg infographic in PowerPoint is to determine the topic you want to address. This can be a complex issue or concept, such as mental health, climate change, or organizational culture.
Step 2: Identify the layers
Identify the layers that make up your topic, just as an iceberg has different layers of ice beneath the surface. These layers can include underlying causes, contributing factors and potential solutions.
Step 3: Choose a design
Select a template that will make your iceberg infographic more visually appealing. You can choose from a variety of pre-designed PowerPoint templates available online or create your own design.
Step 4: Create a graphic of an iceberg
Create a graphic of an iceberg that represents your topic. Use a simple and clear design that will help your audience understand the metaphor.
Step 5: Use colors
Use colors to represent each of the layers of your topic. For example, you can use light blue for the surface layer, dark blue for the middle layer, and deep blue for the bottom layer.
Step 6: Use visuals
Use visual aids such as icons, images or shapes to represent each layer of your topic. These visuals should be relevant to the layer they represent and make the infographic more visually engaging.
Step 7: Insert text
Add text to explain each layer of your topic and highlight key data points. Use bullet points or short phrases to keep the information concise and easy to read.
Step 8: Review your infographic
Review your iceberg infographic in PowerPoint and make any necessary changes. Ensure that the information is clear and concise, the design and visuals are engaging, and the text is accurate.
Conclusion
Creating an iceberg infographic in PowerPoint is a powerful way to communicate complex topics and issues in a visually appealing and engaging way. By following the steps outlined above, you can create an engaging and informative infographic that will help your audience understand the complexities of your topic. Use this guide to create a compelling iceberg infographic that will bring attention to the hidden layers of your topic and inspire your audience to take action.
Use our PPT-Design addons to insert fully editable ready-made infographics template, just update your text & you are done


