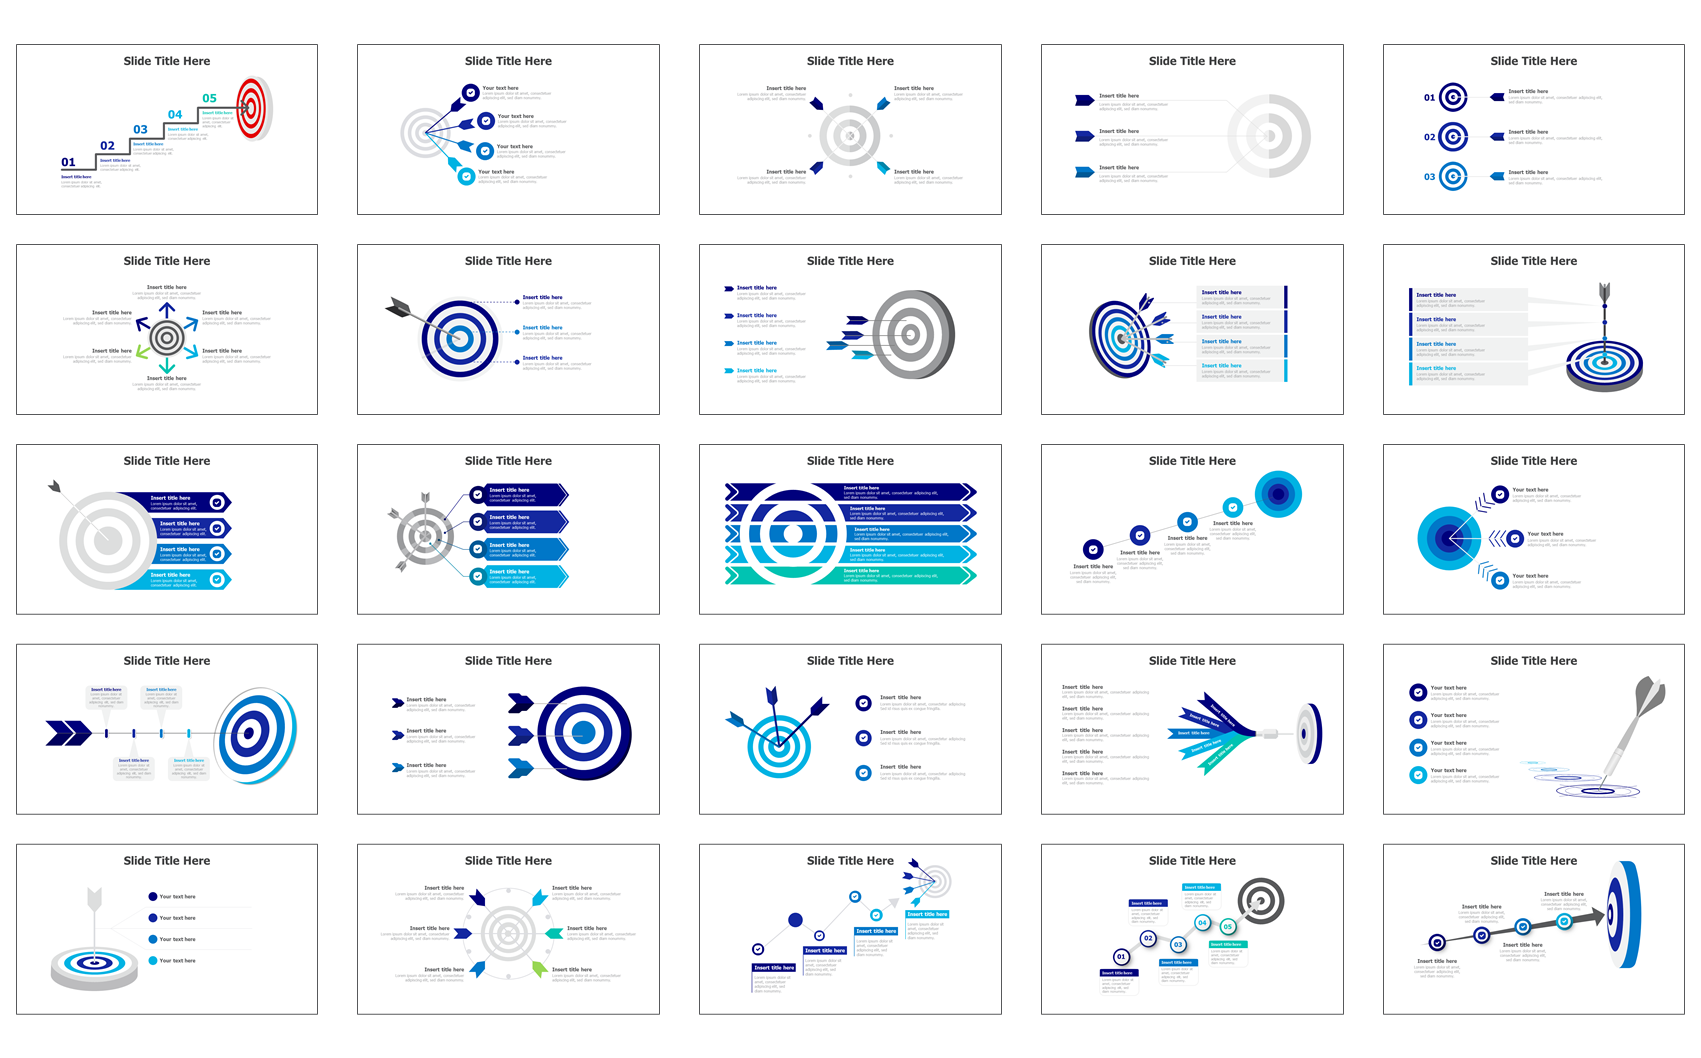
An infographic is a visual representation of data and information that can be used to convey complex messages concisely. Goals infographics are a type of infographic that outlines the objectives and targets of an individual or organization. In this article, we will go through the steps on how to create a goals infographic in PowerPoint.
Step 1: Determine your goals
The first step to creating a goals infographic in PowerPoint is to determine what goals you want to achieve. It can be anything from personal goals to business goals or even project goals.
Step 2: Choose a design
Select a design that will make your goals infographic more visually appealing. You can choose from a variety of pre-designed PowerPoint templates available online or create your own design.
Step 3: Choose the type of infographic
There are several types of infographics you can choose from, including timeline, process, comparison, or statistical infographics. Determine which type of infographic will best represent your goals and objectives.
Step 4: Add key points
Add your key points to the infographic, including your goals, objectives, strategies, and target dates. Use bullet points or short phrases to keep the information concise and easy to understand.
Step 5: Use visuals
Use visuals, such as icons or images, to enhance your key points and keep the audience engaged. These visuals should be relevant to your goals and objectives.
Step 6: Choose an appropriate color scheme
Choose an appropriate color scheme for your goals infographic. Select colors that are visually appealing and reflect the theme of your infographic. Avoid using too many colors and stick to a maximum of three or four.
Step 7: Insert charts and graphs
Include charts and graphs to show progress towards achieving your goals. Choose the appropriate chart or graph type to represent your data. You can use a bar chart, line graph, or pie chart, depending on what story you want to tell.
Step 8: Add a call to action
Include a call to action in your goals infographic. This could be anything from an invitation to follow up with the company, a request for feedback, or an inspirational quote to motivate the audience to act on their goals.
Step 9: Review your infographic
Review your goals infographic in PowerPoint and make any necessary changes. Ensure that the information is clear and concise, the design is engaging, and the visuals are relevant.
Conclusion
Creating a goals infographic in PowerPoint is an effective way to convey your objectives and targets in a visually appealing and easy-to-understand manner. By following the steps outlined above, you can create an infographic that is engaging, informative, and visually appealing. Use this guide to create a compelling goal infographic that will inspire and motivate your audience to act on their goals and achieve their objectives.
Use our PPT-Design addons to insert fully editable ready-made infographics template, just update your text & you are done


