A timeline infographic is a visual representation of a sequence of events arranged in chronological order. It can be used to illustrate the history of a company, the progress of a project, or the development of a product, among other things. Timeline infographics are an effective way to tell a story quickly and concisely. In this article, we’ll take you through the steps on how to create a timeline infographic in PowerPoint.
Step 1: Determine your events
The first step to creating a timeline infographic in PowerPoint is to determine the events you want to highlight. These events can be anything from milestones in a project to important dates in the history of a company.
Step 2: Choose a design
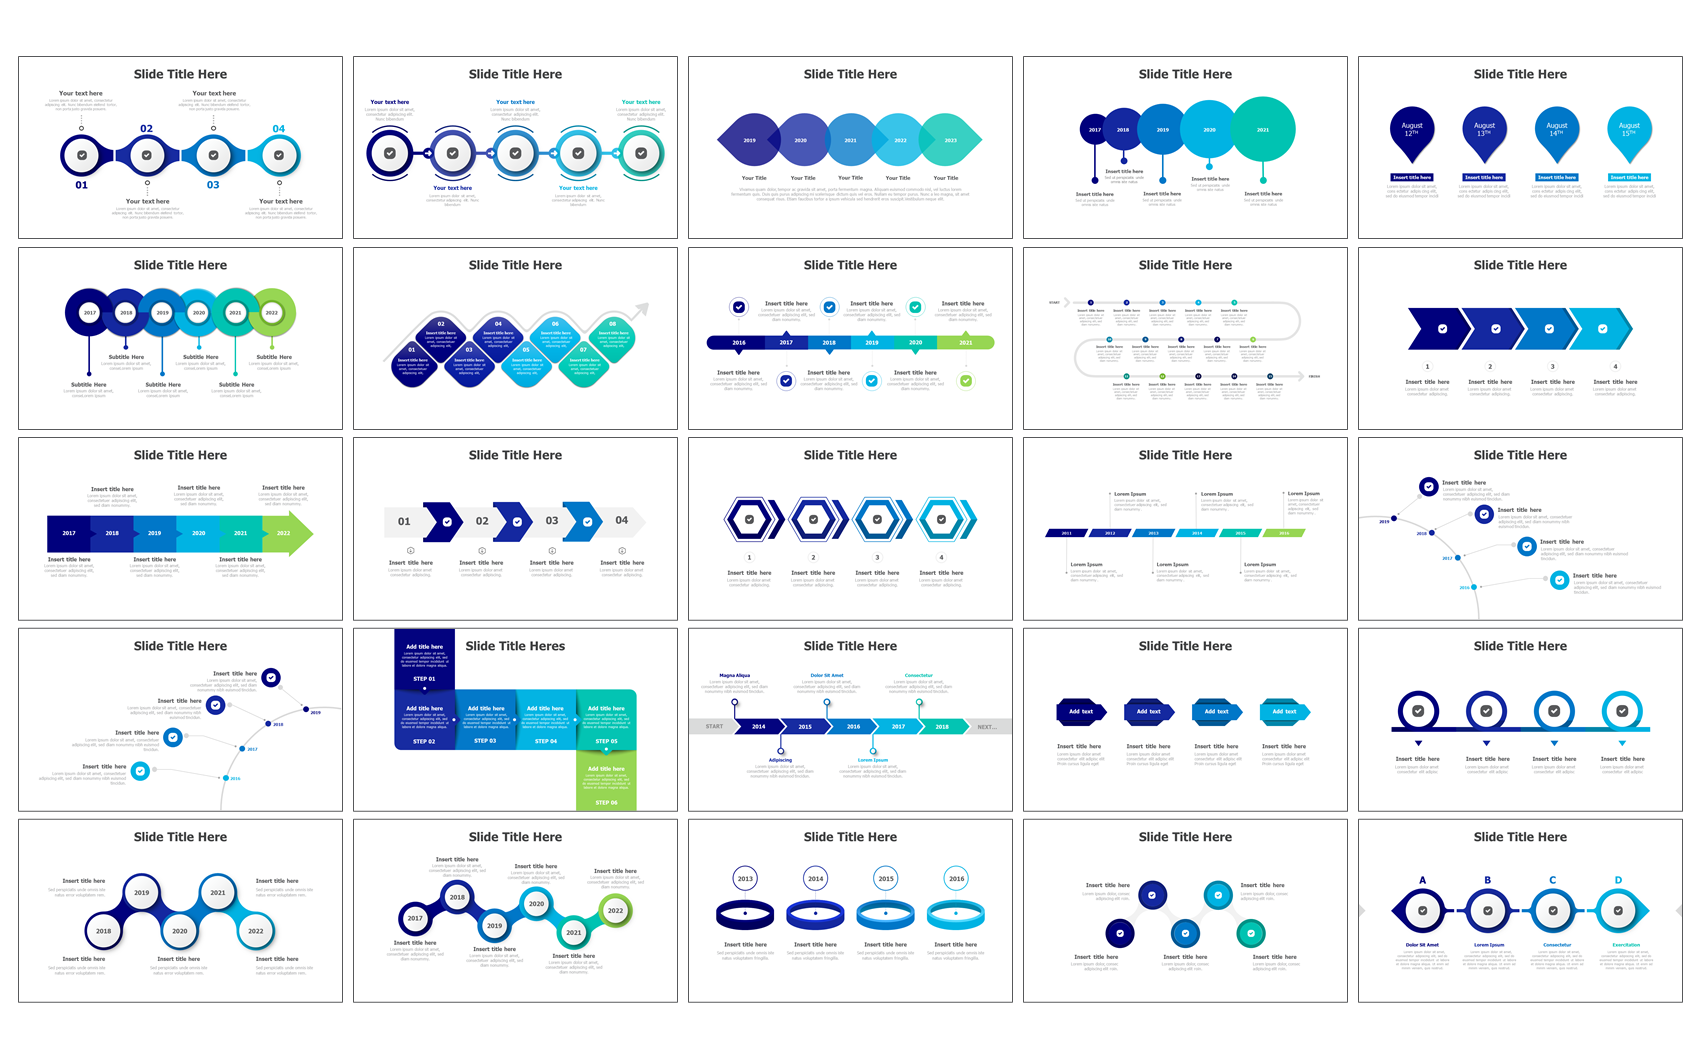
Select a template that will make your timeline infographic more visually appealing. You can choose from a variety of pre-designed PowerPoint templates available online or create your own design.
Step 3: Create a timeline
Create a timeline horizontally or vertically, depending on your preference. For example, if you want to create a timeline for the history of your company, a horizontal timeline might be more appropriate. If you want to show the progress of a project over time, a vertical timeline could work better.
Step 4: Add events
Add events to your timeline, including the date and a brief description of what happened. Use icons or images to represent each event and make your timeline more visually appealing.
Step 5: Use visuals
Use visuals such as icons, images or shapes to enhance your timeline infographic. These visuals should be relevant to each event and add interest to the overall presentation.
Step 6: Choose an appropriate color scheme
Select an appropriate color scheme for your timeline infographic in PowerPoint. Choose colors that are visually appealing and reflect the theme of your infographic. Avoid using too many colors and stick to a maximum of three or four.
Step 7: Insert text
Add additional text to explain each event or highlight key milestones. Use bullet points or short phrases to keep the information concise and easy to understand.
Step 8: Review your infographic
Review your timeline infographic in PowerPoint and make any necessary changes. Ensure that the information is clear and concise, the design and visuals are engaging, and the text is accurate.
Conclusion
Creating a timeline infographic in PowerPoint is an effective way to tell a story and illustrate the sequence of events in a visually appealing way. By following the steps outlined above, you can create an eye-catching and informative timeline infographic that will help you share your story or highlight key milestones in your project or company’s history. Use this guide to create a compelling timeline infographic that will engage your audience and tell your story efficiently.
Use our PPT-Design addons to insert fully editable ready-made timeline infographics templates, just update your text & you are done


