Skip the download.
Insert directly into your slides.
Add templates right inside PowerPoint or Google Slides with our free add-in — no more downloading and importing.
 PowerPoint Add-In
  Google Slides
 You've used all your free downloads today. Upgrade or come back tomorrow.
Match your brand
in one click.
Our add-in automatically applies your brand colors, fonts, and logo to any template — zero design skills required.
You've used all your free downloads today. Upgrade or come back tomorrow.
Your brand deserves
better presentations.
Get fully-branded PowerPoint templates built around your company's identity — fonts, colors, and layouts, all custom-made.
You've used all your free downloads today. Upgrade or come back tomorrow.
Daily download limit reached
Free accounts get a limited number of downloads per day. Upgrade for unlimited access or try again tomorrow.
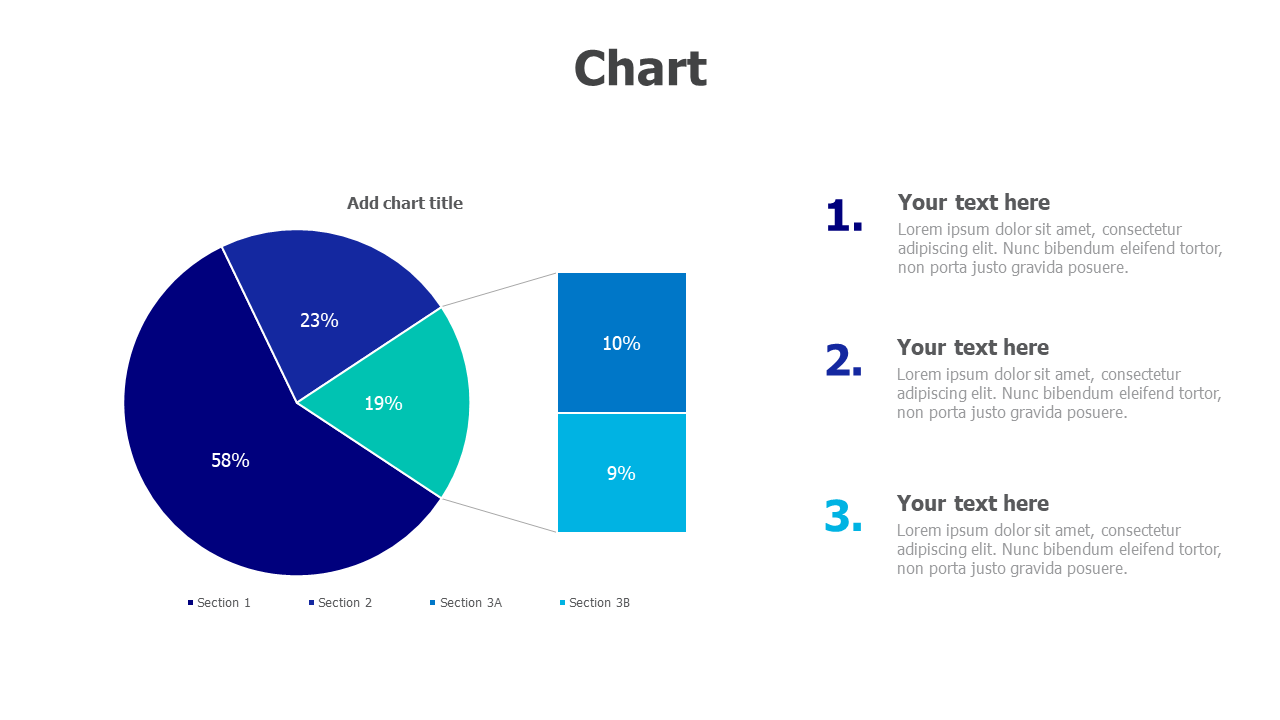
Four-Section Pie Chart with Breakdown Bars
About This Template
This PowerPoint template combines a detailed pie chart with complementary bar breakdowns, perfect for presenting data segmentation and detailed analysis. Features four distinct sections (58%, 23%, 19%, 10%/9%) with connected bar charts for deeper insights. Ideal for business analysts, market researchers, and consultants who need to show both overview and detailed breakdowns in financial reports, market analysis, or performance dashboards.
Browse more Charts templates to find the perfect design for your presentation. Explore Charts →
What's Included
- Match Your Brand in One Click
- PowerPoint (.pptx) & Google Slides
- 100% Editable — Colors, Text & Layout
- Free for Personal & Commercial Use
How to Edit This Template
Click Download Template to get the .pptx file
Open in PowerPoint or upload to Google Slides
Edit colors, text & data — or use our add-in for one-click branding


