다운로드 건너뛰기.
슬라이드에 직접 삽입.
PowerPoint 또는 Google Slides에서 직접 템플릿을 추가하세요.
 PowerPoint 추가 기능
  Google Slides
 원클릭으로
브랜드 매칭.
추가 기능이 자동으로 브랜드 색상, 글꼴, 로고를 적용합니다.
브랜드에 걸맞는
더 나은 프레젠테이션.
회사 아이덴티티에 맞는 맞춤 PowerPoint 템플릿을 받으세요.
오늘의 무료 다운로드를 모두 사용했습니다.
일일 다운로드 한도 도달
무료 계정은 일일 다운로드 수가 제한됩니다.
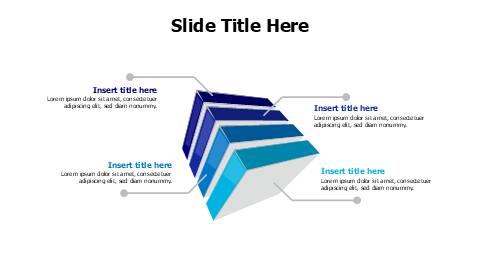
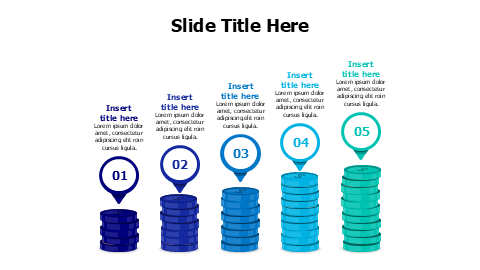
Five Stage Growth Database Cylinder Chart
이 템플릿 소개
This infographic template features five ascending cylindrical database icons in gradient blue to teal colors, perfect for visualizing progressive data growth, financial milestones, or business development stages. Each cylinder stack includes numbered markers (01-05) with text placeholder areas, making it ideal for presentations on revenue growth, data accumulation, investment phases, or sequential business processes.
더 보기 Miscellaneous 프레젠테이션에 완벽한 디자인을 찾기 위한 템플릿. 탐색 Miscellaneous →
포함 내용
- 원클릭으로 브랜드 매칭
- PowerPoint (.pptx) & Google Slides
- 100% 편집 가능 — 색상, 텍스트 & 레이아웃
- 개인 & 상업적 용도 무료
이 템플릿 편집 방법
템플릿 다운로드를 클릭하여 .pptx 파일을 받으세요
PowerPoint에서 열거나 Google Slides에 업로드하세요
색상, 텍스트 & 데이터를 편집하거나 추가 기능으로 브랜딩 적용