다운로드 건너뛰기.
슬라이드에 직접 삽입.
PowerPoint 또는 Google Slides에서 직접 템플릿을 추가하세요.
 PowerPoint 추가 기능
  Google Slides
 원클릭으로
브랜드 매칭.
추가 기능이 자동으로 브랜드 색상, 글꼴, 로고를 적용합니다.
브랜드에 걸맞는
더 나은 프레젠테이션.
회사 아이덴티티에 맞는 맞춤 PowerPoint 템플릿을 받으세요.
브랜드 글꼴 임베드
브랜드 색상 고정
맞춤 레이아웃
팀 준비 완료
오늘의 무료 다운로드를 모두 사용했습니다.
일일 다운로드 한도 도달
무료 계정은 일일 다운로드 수가 제한됩니다.
무제한 다운로드
프리미엄 템플릿
우선 지원
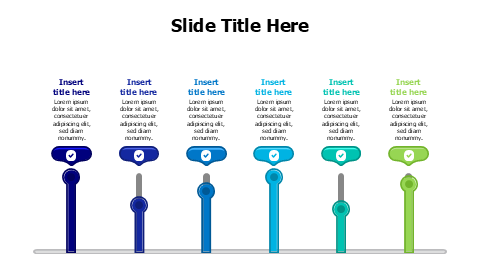
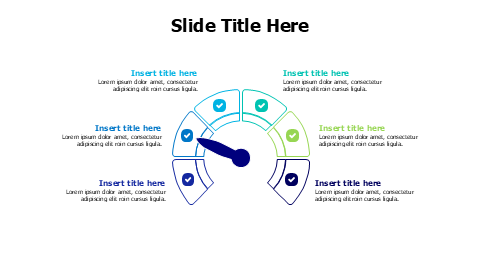
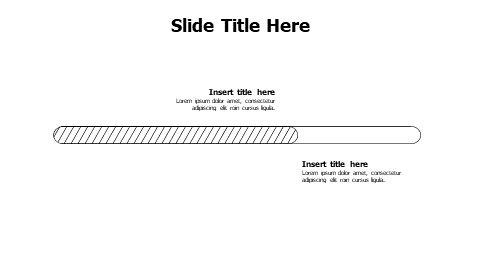
Two Point Progress Bar Sketch Template
이 템플릿 소개
Hand-drawn progress bar infographic featuring two customizable data points in a clean outline style. Perfect for presentations showing completion rates, survey results, or comparative metrics. The sketch-style design adds visual interest while maintaining professional clarity for business and educational use.
포함 내용
- 원클릭으로 브랜드 매칭
- PowerPoint (.pptx) & Google Slides
- 100% 편집 가능 — 색상, 텍스트 & 레이아웃
- 개인 & 상업적 용도 무료
이 템플릿 편집 방법
1
템플릿 다운로드를 클릭하여 .pptx 파일을 받으세요
2
PowerPoint에서 열거나 Google Slides에 업로드하세요
3
색상, 텍스트 & 데이터를 편집하거나 추가 기능으로 브랜딩 적용