Skip the download.
Insert directly into your slides.
Add templates right inside PowerPoint or Google Slides with our free add-in — no more downloading and importing.
 PowerPoint Add-In
  Google Slides
 You've used all your free downloads today. Upgrade or come back tomorrow.
Match your brand
in one click.
Our add-in automatically applies your brand colors, fonts, and logo to any template — zero design skills required.
You've used all your free downloads today. Upgrade or come back tomorrow.
Your brand deserves
better presentations.
Get fully-branded PowerPoint templates built around your company's identity — fonts, colors, and layouts, all custom-made.
You've used all your free downloads today. Upgrade or come back tomorrow.
Daily download limit reached
Free accounts get a limited number of downloads per day. Upgrade for unlimited access or try again tomorrow.
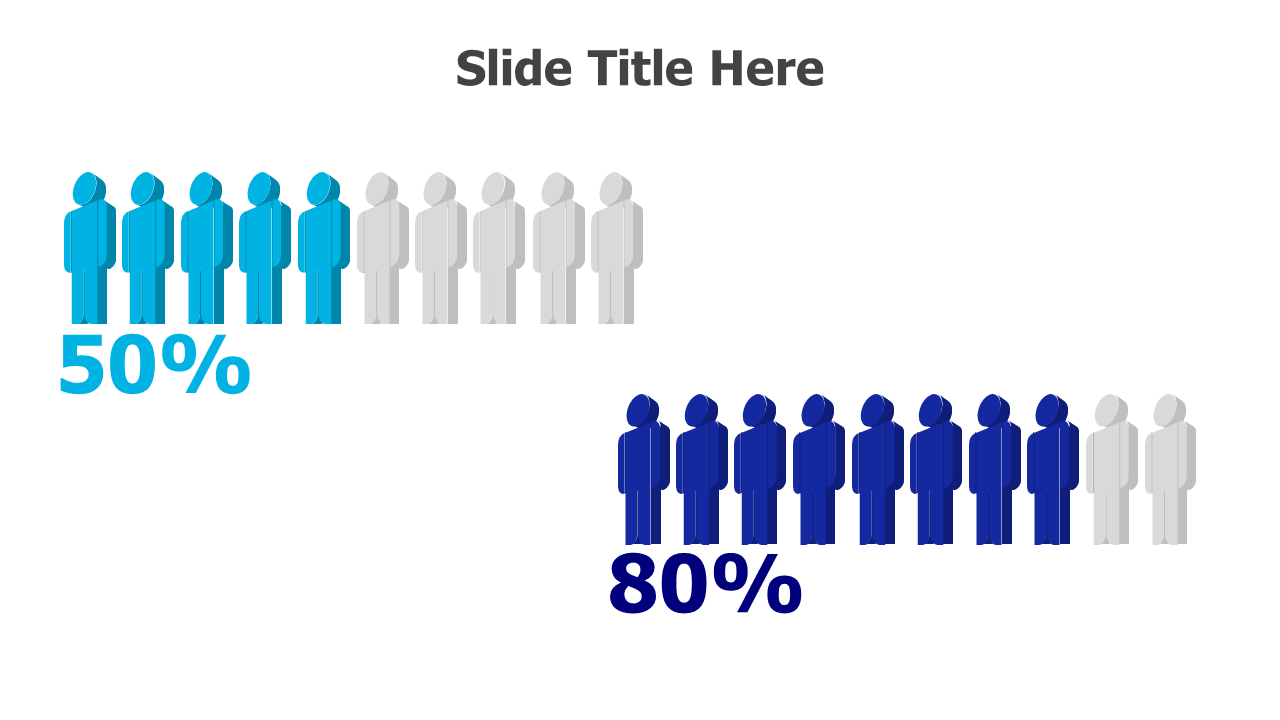
人口パーセンテージ人型アイコンインフォグラフィック
このテンプレートについて
人口統計とパーセンテージ分布を表すために人型アイコンを使用したビジュアル人口統計インフォグラフィック。調査結果、市場調査プレゼンテーション、および人口統計分析に最適です。このテンプレートは、カラーコード化された人型シルエットを使用して2つの比較グループと50%および80%の比率を表示し、複雑なデータをビジネスプレゼンテーションおよびレポート向けに即座に理解可能にします。
もっと見る Miscellaneous プレゼンテーションに最適なデザインを見つけるためのテンプレート。 探索 Miscellaneous →
含まれるもの
- ワンクリックでブランドマッチング
- PowerPoint (.pptx) & Google Slides
- 100% 編集可能 — 色、テキスト & レイアウト
- 個人 & 商用利用無料
このテンプレートの編集方法
テンプレートをダウンロードをクリックして .pptx ファイルを取得
PowerPointで開くか、Google Slidesにアップロード
色、テキスト & データを編集 — またはアドインでワンクリックブランディング