Skip the download.
Insert directly into your slides.
Add templates right inside PowerPoint or Google Slides with our free add-in — no more downloading and importing.
 PowerPoint Add-In
  Google Slides
 You've used all your free downloads today. Upgrade or come back tomorrow.
Match your brand
in one click.
Our add-in automatically applies your brand colors, fonts, and logo to any template — zero design skills required.
You've used all your free downloads today. Upgrade or come back tomorrow.
Your brand deserves
better presentations.
Get fully-branded PowerPoint templates built around your company's identity — fonts, colors, and layouts, all custom-made.
You've used all your free downloads today. Upgrade or come back tomorrow.
Daily download limit reached
Free accounts get a limited number of downloads per day. Upgrade for unlimited access or try again tomorrow.
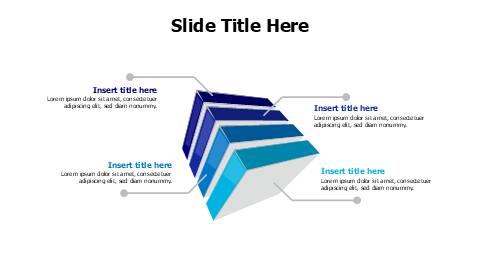
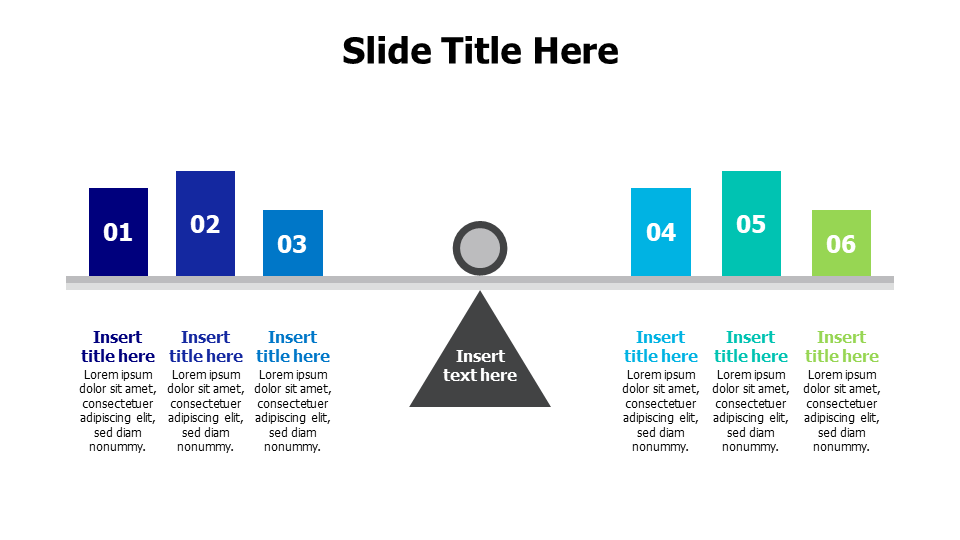
6-Point Balance Scale Infographic Template
حول هذا القالب
This PowerPoint template features six colorful blocks arranged as a balanced scale with a central fulcrum point, perfect for presenting comparative data, pros and cons analysis, or weighted decision-making processes. Ideal for business analysts, consultants, and project managers who need to visualize balanced relationships between multiple factors or demonstrate equilibrium in their presentations.
تصفح المزيد من Multipurpose القوالب للعثور على التصميم المثالي لعرضك التقديمي. استكشف Multipurpose →
ما يتضمنه القالب
- مطابقة علامتك التجارية بنقرة واحدة
- بوربوينت (.pptx) & جوجل سلايدز
- 100% قابل للتعديل — الألوان والنص & التخطيط
- مجاني للاستخدام الشخصي & التجاري
كيفية تعديل هذا القالب
انقر تحميل القالب للحصول على ملف .pptx
افتح في بوربوينت أو ارفع إلى جوجل سلايدز
عدّل الألوان والنص & البيانات — أو استخدم الإضافة لتطبيق العلامة التجارية بنقرة