تخطَّ التنزيل.
أدرج مباشرة في شرائحك.
أضف النماذج مباشرة داخل PowerPoint أو Google Slides باستخدام الوظيفة الإضافية المجانية — لا مزيد من التنزيل والاستيراد.
 PowerPoint Add-In
  Google Slides
 لقد استخدمت جميع تنزيلاتك المجانية اليوم. قم بالترقية أو عد غداً.
طابق علامتك التجارية
بنقرة واحدة.
تطبق الإضافة الخاصة بنا تلقائياً ألوان علامتك التجارية وخطوطك وشعارك على أي قالب — بدون الحاجة إلى مهارات تصميم.
لقد استخدمت جميع تنزيلاتك المجانية اليوم. قم بالترقية أو عد غداً.
علامتك التجارية تستحق
عروضاً تقديمية أفضل.
احصل على قوالب PowerPoint مكتملة العلامة التجارية مبنية حول هوية شركتك — الخطوط والألوان والتخطيطات، كل ذلك مخصص.
لقد استخدمت جميع تنزيلاتك المجانية اليوم. قم بالترقية أو عد غداً.
تم الوصول إلى حد التنزيلات اليومي
تحصل الحسابات المجانية على عدد محدود من التنزيلات يومياً. قم بالترقية للحصول على وصول غير محدود أو حاول مرة أخرى غداً.
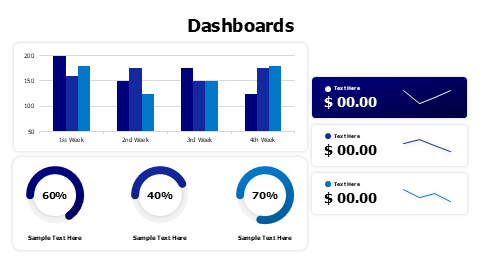
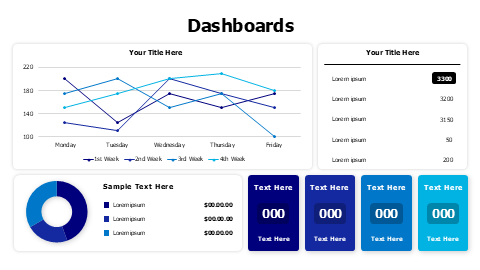
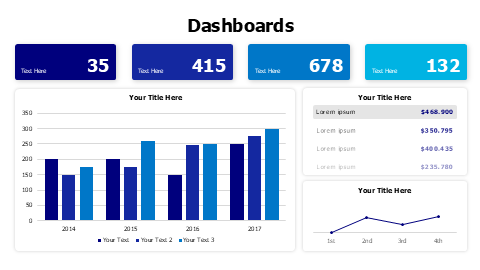
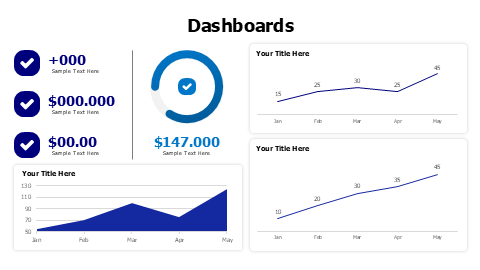
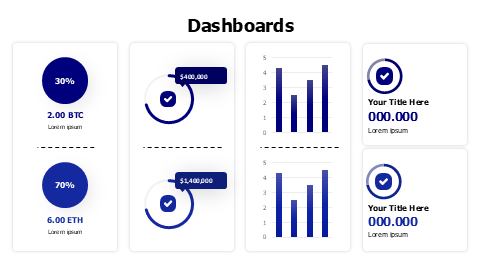
8-Widget Business Analytics Dashboard Template
حول هذا القالب
Comprehensive dashboard template featuring 8 key performance widgets including circular progress indicators, bar charts, and metric displays. Perfect for executives and analysts to present financial data, cryptocurrency portfolios, and business KPIs in a clean, organized layout. Excel-linked charts allow real-time data updates with simple right-click editing.
تصفح المزيد من Dashboards القوالب للعثور على التصميم المثالي لعرضك التقديمي. استكشف Dashboards →
ما يتضمنه القالب
- مطابقة علامتك التجارية بنقرة واحدة
- بوربوينت (.pptx) & جوجل سلايدز
- 100% قابل للتعديل — الألوان والنص & التخطيط
- مجاني للاستخدام الشخصي & التجاري
كيفية تعديل هذا القالب
انقر تحميل القالب للحصول على ملف .pptx
افتح في بوربوينت أو ارفع إلى جوجل سلايدز
عدّل الألوان والنص & البيانات — أو استخدم الإضافة لتطبيق العلامة التجارية بنقرة