Skip the download.
Insert directly into your slides.
Add templates right inside PowerPoint or Google Slides with our free add-in — no more downloading and importing.
 PowerPoint Add-In
  Google Slides
 You've used all your free downloads today. Upgrade or come back tomorrow.
Match your brand
in one click.
Our add-in automatically applies your brand colors, fonts, and logo to any template — zero design skills required.
You've used all your free downloads today. Upgrade or come back tomorrow.
Your brand deserves
better presentations.
Get fully-branded PowerPoint templates built around your company's identity — fonts, colors, and layouts, all custom-made.
You've used all your free downloads today. Upgrade or come back tomorrow.
Daily download limit reached
Free accounts get a limited number of downloads per day. Upgrade for unlimited access or try again tomorrow.
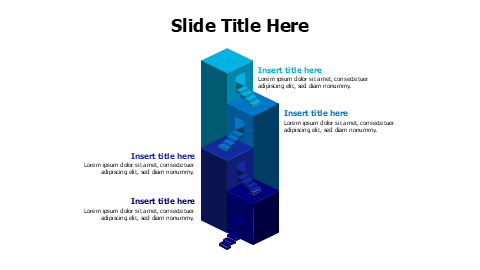
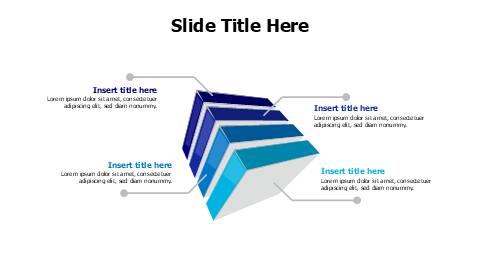
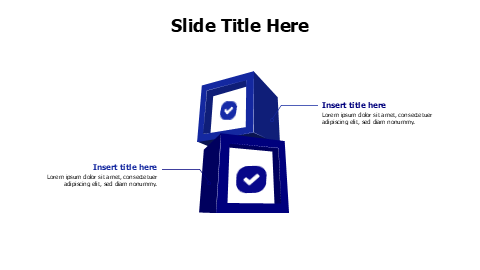
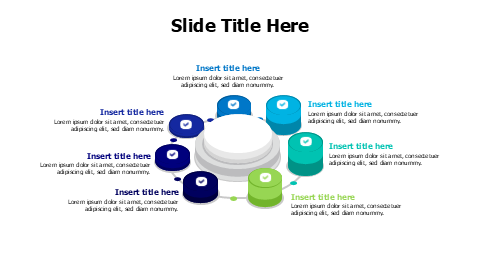
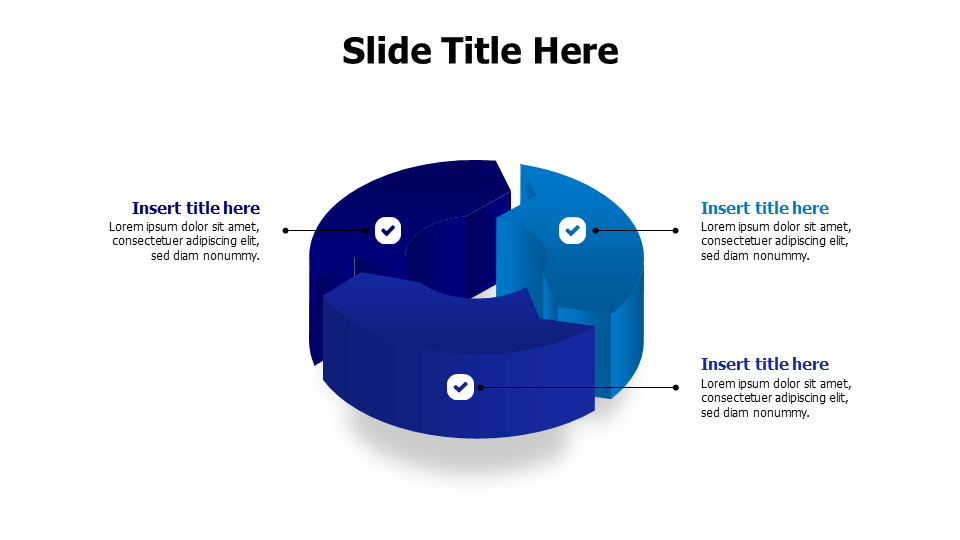
3-Section Cylinder Chart Infographic Template
حول هذا القالب
This 3D cylindrical chart template features three distinct segments with checkmark icons and callout text areas, perfect for presenting sequential processes, market segments, or project phases. Business professionals can use this visual to break down complex data into digestible parts while maintaining audience engagement through its dimensional design and clean blue gradient color scheme.
Browse more 3D templates to find the perfect design for your presentation. Explore 3D →
ما يتضمنه القالب
- Match Your Brand in One Click
- PowerPoint (.pptx) & Google Slides
- 100% Editable — Colors, Text & Layout
- Free for Personal & Commercial Use
How to Edit This Template
Click Download Template to get the .pptx file
Open in PowerPoint or upload to Google Slides
Edit colors, text & data — or use our add-in for one-click branding